Showing posts with label real world. Show all posts

Children's Books for Algebra 2

Children's books are are a great way of introducing concepts and to help build a classroom community.  Students love sitting together on the floor and listen to a teacher read aloud a picture book. Letting a picture book and prior knowledge give them a hook into the curriculum.

Here are three great books to help teach some Algebra 2 concepts.


Follow the Line
by Laura Ljungkvist

This picture book goes from the city to farms. Each scene contains questions designed to get children counting, thinking, and observing.  Children would count 5-6 times on each page.

In Algebra 2 class I am going to read aloud the book, but instead of going over the questions in the book I am going to ask different questions.

What types of lines do you see?
Which ones of these are functions?
Which of these are not functions?
What type of slope do some of these lines have?


The Man Who Walked Between the Towers
by Mordicai Gerstein

This picture book is about Philippe Petit who tightrope walked across from one World Trade Center tower to the other. He performed tricks, walking, and dancing for an hour. The book has great and different types of numbers you could number talk during the read aloud.

The way that I am going to use the book in Algebra 2 is to get students use to the idea that mathematical models illustrate the behavior of real world situations.

During the talk I am going to ask the students at specific times to model different situations in the book and ask them about the math being used.


Lifetime: Amazing Numbers in Animal Lives
by Lola M. Schaefer

This book talks about the different animals what can happen in their entire lifetime.

An example, in one lifetime an alligator will build 22 nests and lay 550 eggs.

In Algebra 2 we are going to use this book to introduce students to exponential expressions and how they can be written in different ways.  We are going to talk about If one alligator lays 550 eggs, and then one of those alligators lays 550 eggs. How many alligators in twenty generations?

Financial Literacy in Math

Financial literacy is the ability to understand how money works in the world: how someone manages to earn or make it, how that person manages it, how he/she invests it, and how that person donates it to help others.

I believe that my past Algebra 2 students understand the material.  I don't think that they could go out and apply those concepts (for example in a job environment.)

Looking at exponential functions, for example, students can look at the depreciation of a new or their old car in terms of re-sale value.  Students can enter the data and draw a scatter plot on a sheet of graph paper.

If students didn't have a car they could search for one.  For example I searched my wife's car a 2015 Chevy Cruze.

The MSRP is $16,170

After the first year it depreciates: $7,904
After the second year: $1,200
After the third year: $1,000
After the fourth year: $875
After the fifth year: $675

Students could then plot this and look for the exponential line of best fit through that data on Desmos. You could then prompt follow up questions, what will the value be 8 years from now? Is $8,456 a good price now for a 2015 Chevy Cruze?

For slope and finding slope of a line, give them real-world data to extrapolate.  This data below came from the Nebraska Department of Roads.


What is the slope of each year from January to May?  What is the slope of each year from May to December?  What causes this?

What do you expect June to look like? Can we determine what the price will be December?

Having students know the concepts is one thing.  Having them use the concepts beyond the classroom is what we are looking for as math teacher.

Angle of Impact

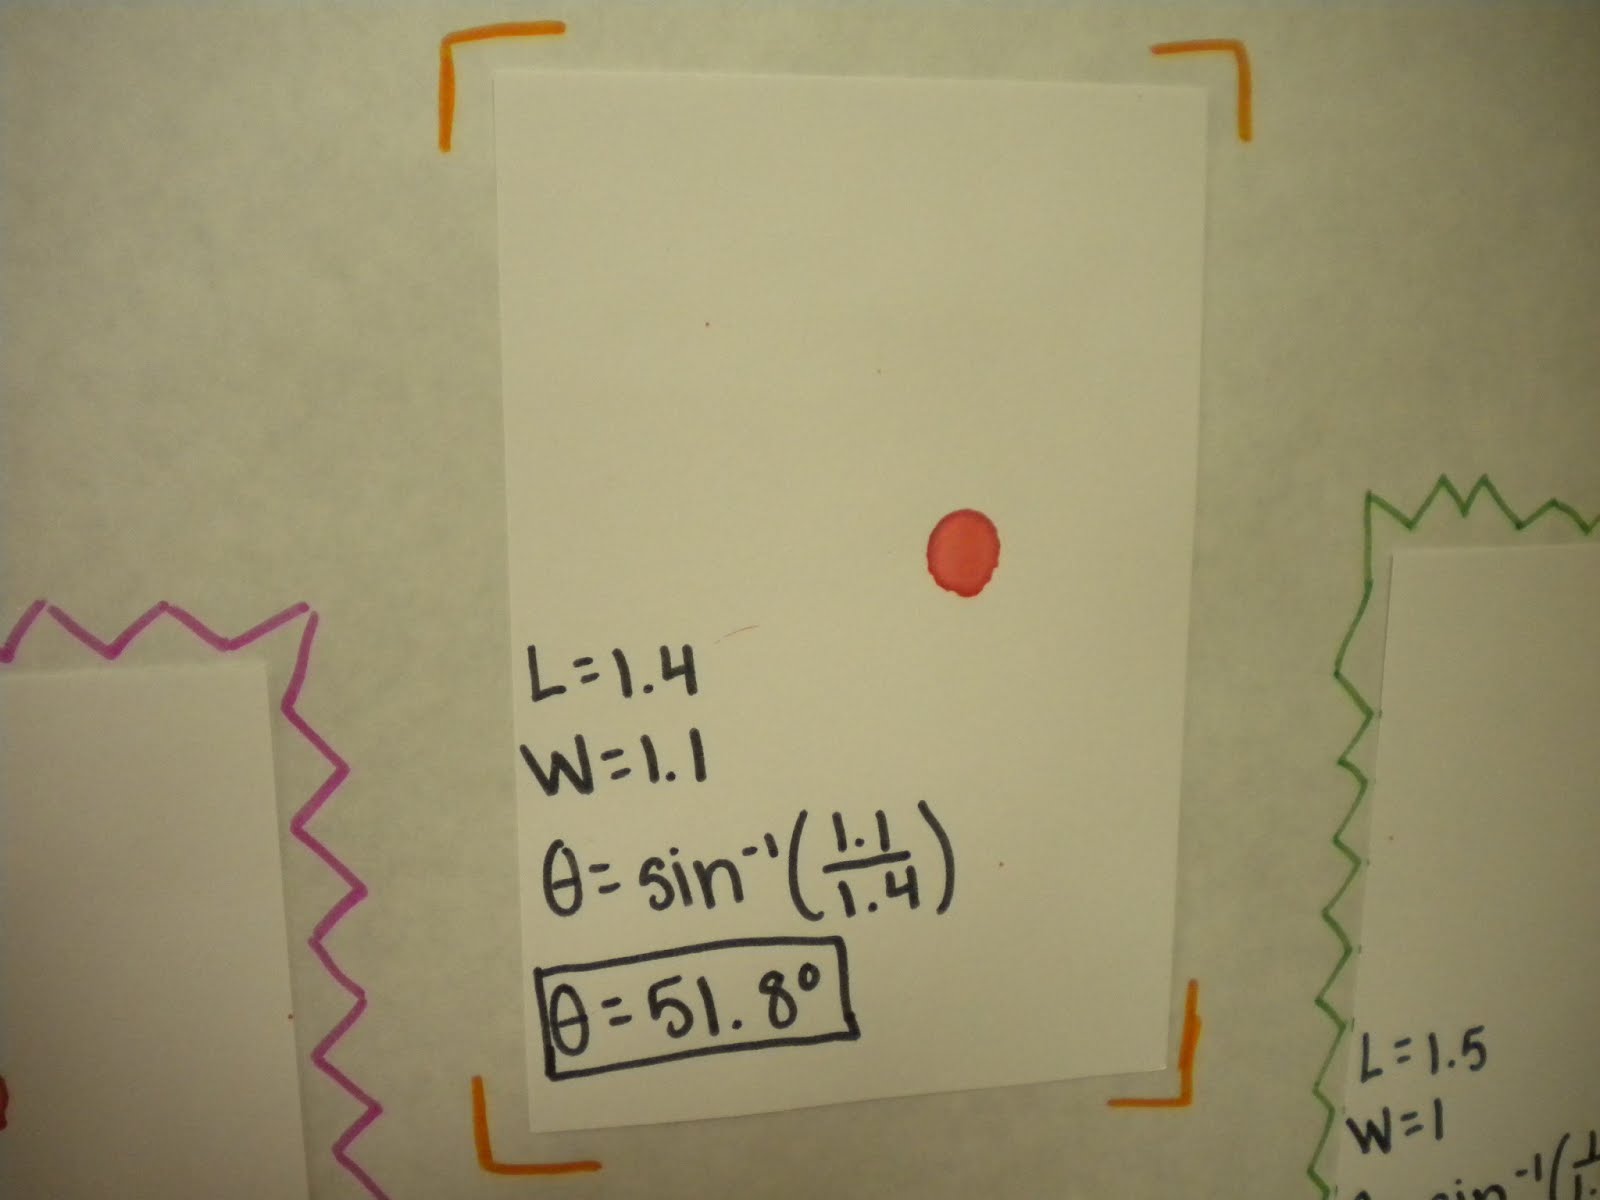
Blood splatter analysis is a powerful forensic tool.  Spatter patterns allow investigators to reconstruct what happened at a crime scene.  The blood spatter pattern "tells a story" of the crime and help the investigators determine if eyewitness accounts are consistent with the evidence.  To study impact angle, you will need to use trigonometry math skills.

Use trigonometric functions to determine if the impact angle for any given blood droplet.

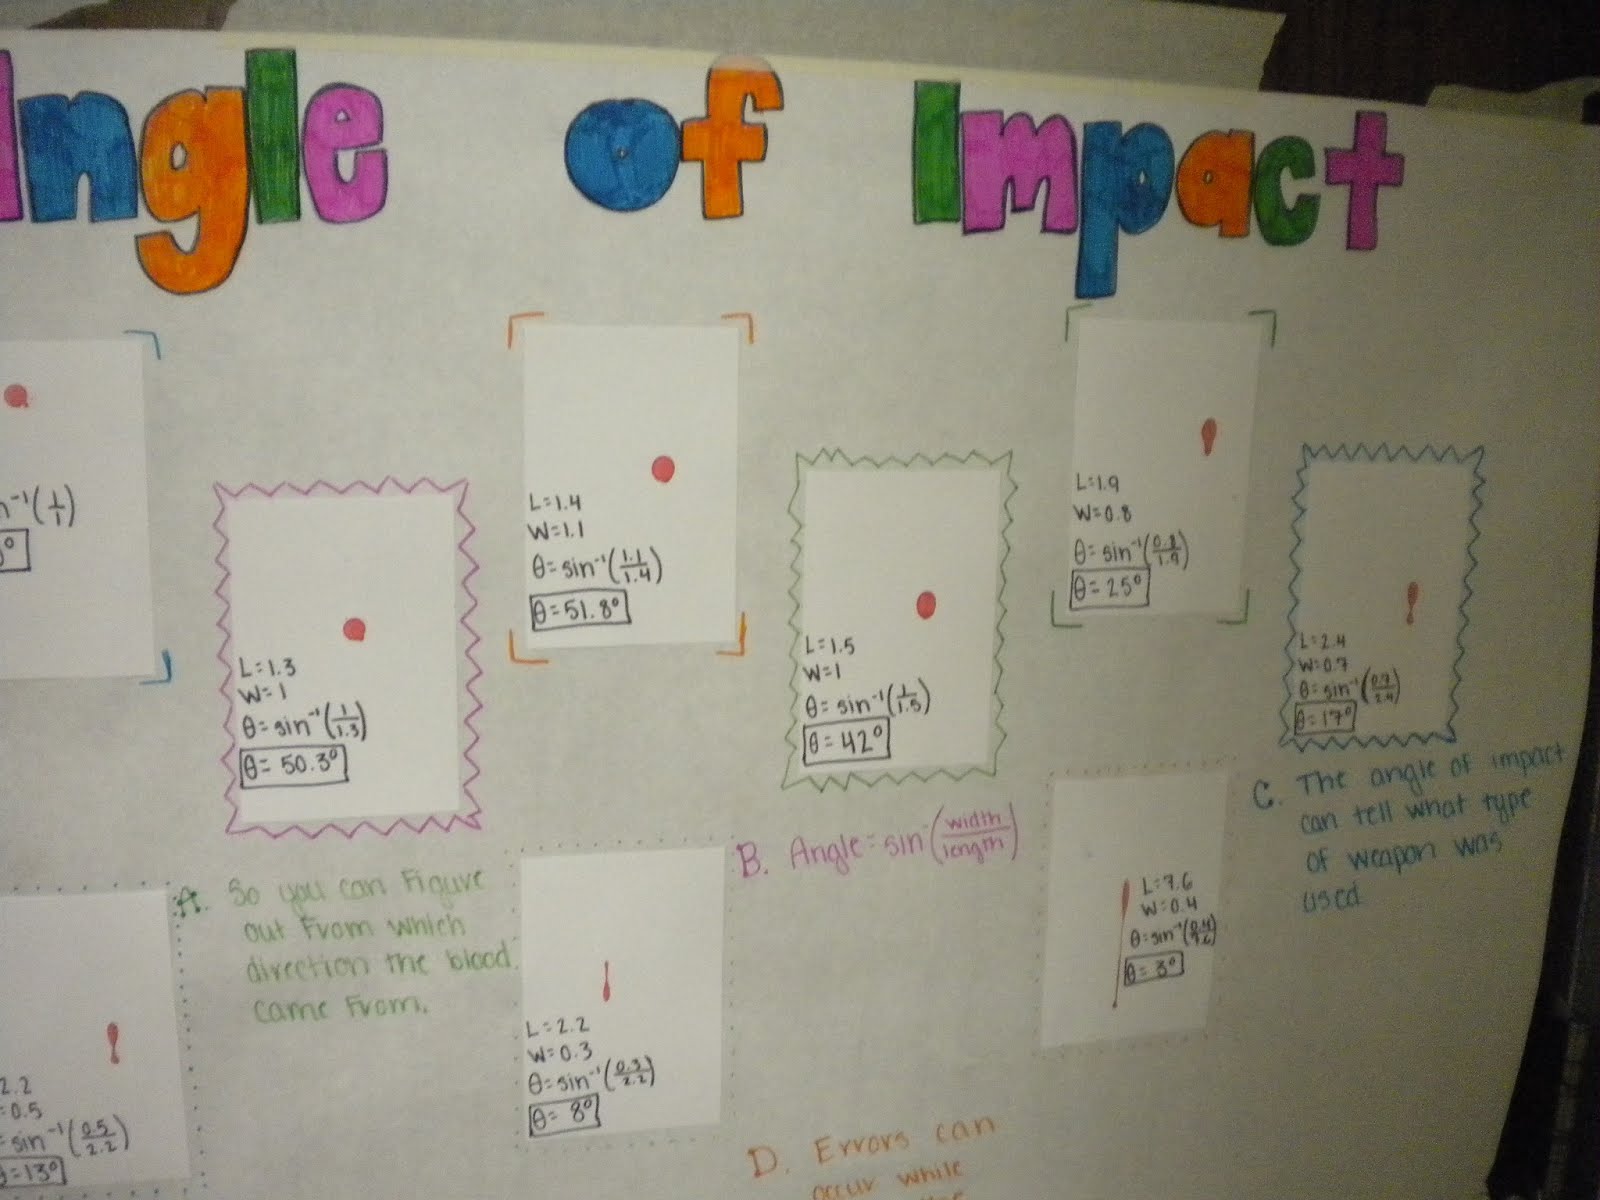
By accurately measuring the length and width of a bloodstain, you can calculate the impact angle using the following sine formula:

c=opposite/hypotenuse=width(a-b)/length(b-c).

To determine the angle of impact, take the inverse sine to get degrees.

Lesson: Angle of Impact Lab
Objective: For students to learn and use trig functions in the real world.  Students should be able to solve for angles in a right triangle.

Standards: Apply content to real-world scenarios.

Time: 45 minute class.

Set-up: 10 minutes before class.

Procedure:
  • As students enter the classroom, students will begin work on the daily question.
  • After two students go up to the board to work out the daily question, go over the correct answer with them.
  • Spend 5 minutes going over any missed or confusing questions the students had on the assignment.
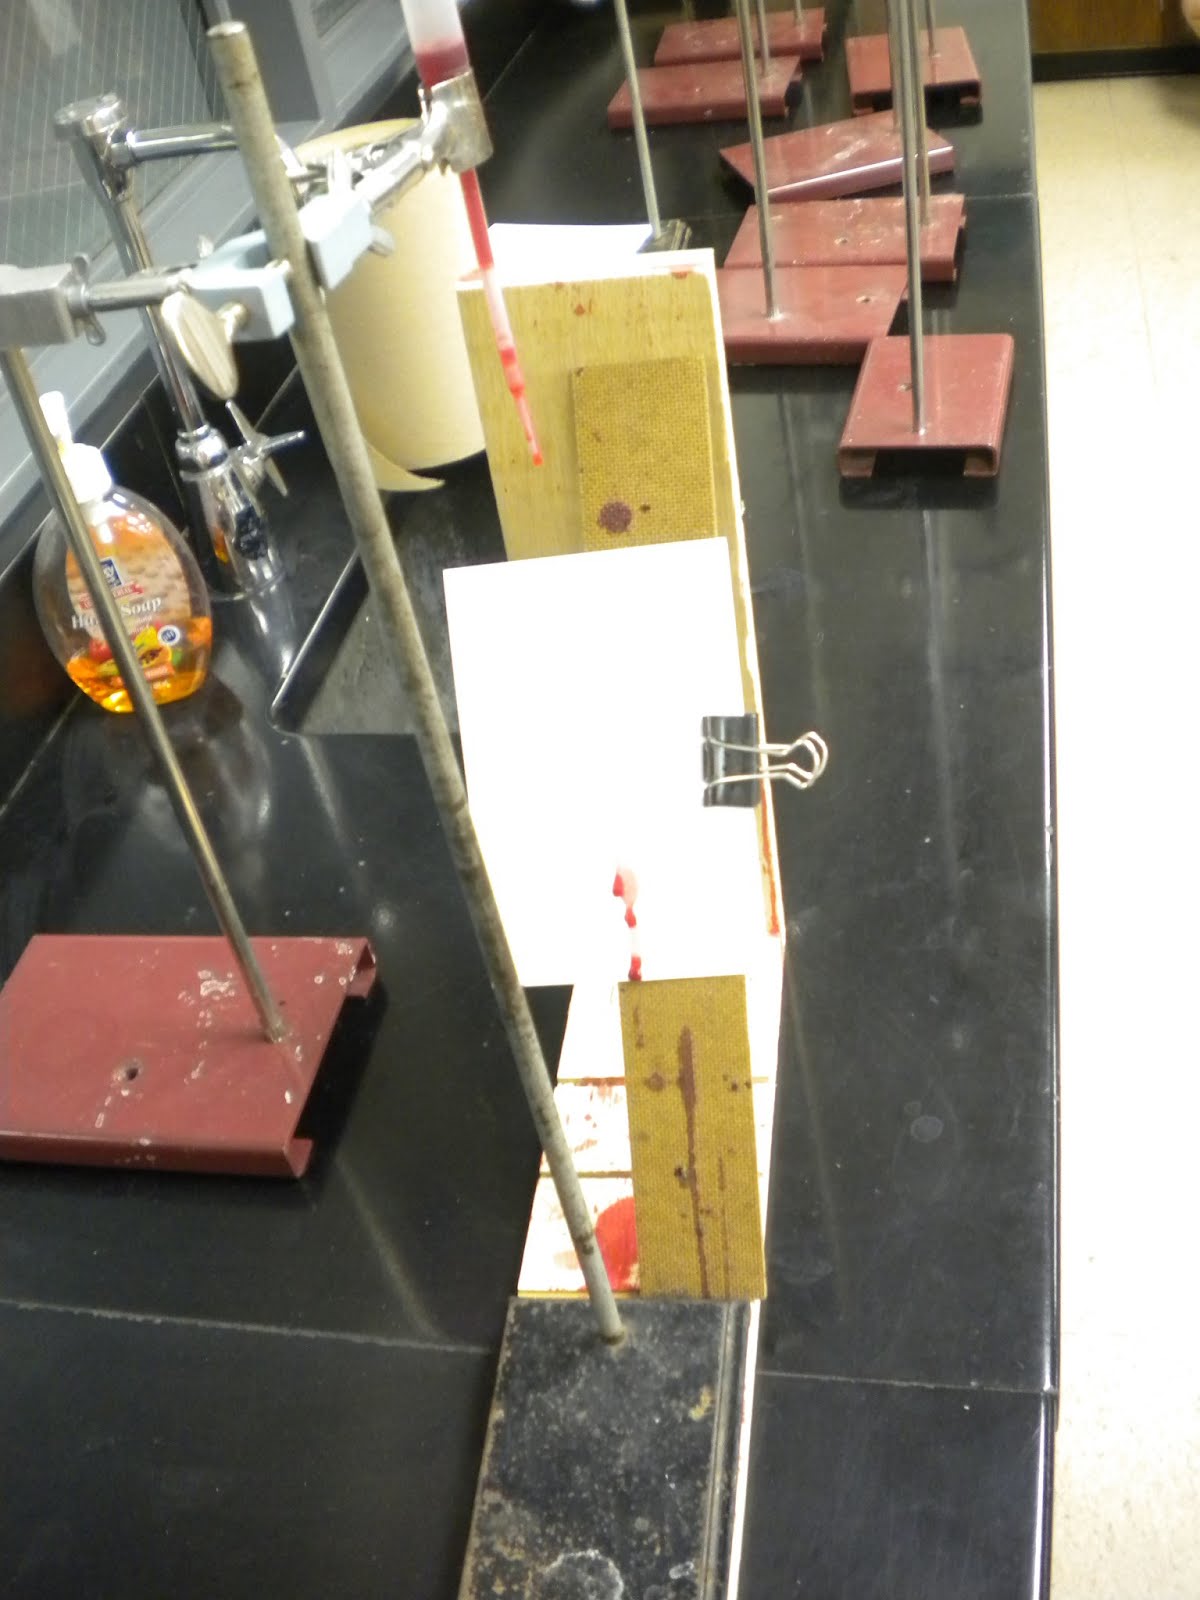
  • Before the start of the angle of impact lab share with them a quick way of determining the blood splatter pattern. It should look like the image to the right.
  • Have students spend 20-30 minutes working on the angle of impact lab.  Worksheet is attached.  Students should be in groups of 2 or 3.
  • When students are finished with the angle of impact lab, students are to complete the final part of the lab with a poster.  Students should spend the remainder of the classroom working on the poster and putting their finishing touches on the assignment.
  • 2-3 minutes before the bell rings students should fill out their exit slip, for an informal assessment.

Goals: Students should be able to use their knowledge to real-world scenarios.  Students should be able to use the angle of impact formula and know how it is derived.  Students should be creative and put their math knowledge to the test to apply the concepts provided. 


Using Instagram in Math Class

Instagram is a free, fun, and simple way to make and share photos on the iPhone and iPad.  Students pick from one of several filtered effects to breathe new life into mobile photos.  Students can transform everyday moments in the classroom in see and to works of art.  Students can show photos in a simple photo stream with friends, classmates, teachers, and family.


There are some examples below where you can use Instagram in the classroom:

Problem Solving
Turn a dry subject with numbers and formulas, and connect it to art through visual expression. Younger students can capture mathematical concepts through visual problem solving re-enactments (like word problems) or even snapping photos of complex formulas designed on poster board.

Classroom Account
Every month, take a few photos of the student’s progress. Families can follow the classroom account and keep up with what their child is learning and doing.


Teacher Photos
Parents and community members love to know about the teachers who work in the schools. Have the kids interview all the teachers in a school, writing up a bio of each instructor and tagging a photo of them on Instagram. The filters make even the poorest photos look professional! You can take pictures of homework questions or even some of the answers to the problems.


Math in the Real World
Similar to digital storytelling, this would allow students to explore issues in their world through a visual medium. I want them to engage in citizen journalism. Students can use the mobile devices to express their social voice and find math in the real world by tying together photos of math concepts and definitions.

Math Prompts
Last year, I found photographs and created writing prompts. Sometimes, they were geared toward poetry or narrative while other times they were persuasive or informational. I will encourage students to develop their own photo prompts using Instagram.  Having photos where students come up with their own math story problems by a photo.  

Metaphors in Math
I will give students concepts from any of the subject areas and ask students to find a metaphor that fits the concept. They will use Instagram to find the metaphor and then describe it in the comments section. 

What ways can you think of where you could use Instagram in your classroom?  What other types of iPad applications do you use in the math classroom?

Check out two sites that offer educational ways of incorporating Instagram into the classroom below:
10 Instagram Ideas
Creative Ways of using Instagram

Download the app here: Instagram


KUCE Taxonomy

I was trying to think of ways of implementing more Bloom's Taxonomy in my classroom and I had an epiphany.  Bloom's Taxonomy is dated for 21st Century learners and does not give students the freedoms of a classroom atmosphere for the real-world.  So I came up with my own taxonomy: KUCE Taxonomy.  It takes bits and pieces from Bloom's along with some adaptations of my own.

K: Know
In Bloom's Taxonomy the first two base stages of the pyramid are remember and understand and if you combine these two bases together you get know. Students remembering and understanding the material is normally done in one or two days depending on the material.  Students in most classrooms listen to lectures and either understand or don't.  In my classroom I want students to know the material and be able to get to the next step in the learning process as quickly as possible.  I believe that knowing something is just the first step in the process of learning.

U: Use
Again in Bloom's Taxonomy the next two steps in the pyramid are Apply and Analyze, in my understanding this is using the material that you know.  After students know and understand the material, I want them to use the material in my classroom, in the picture below of the actual taxonomy it is semi-broken down into two different parts: examples and real world.  I put a wavy line between the two, because you can use different ways of using the material and sometimes it may not be examples or going as far to the real world, but the line is blurred and in my classroom I want to have students come up with examples and once they have mastered using examples I want them to learn how to use this information in the real-world.

C: Create
Once students know the material and can use the material, the next logical step is create and in Bloom's Taxonomy this changes a little bit (Bloom has it at the pinnacle of the pyramid).  Once again I have semi-broken down the creative stage in to two parts: local/community and global.  For 21st Century learners, students need to be able to apply their knowledge in their community and globally, students need to be informed citizens and care about the world they live in.  The arrows are in their, because students need to be moving in the direction of global learning and thinking about others outside of their local bubbles.  In my classroom for example, students might create a presentation for the classroom then students set up either a website to take their use of knowledge to the next level the global web.  In other classrooms it might be researching tyrannies in other parts of the world, not just their own backyard.

E: Evaluate
At this point, in my classroom, students have mastered the material.  They have become small masters of the material and once they have completed something on the global scale they can evaluate others work.  This might be in the sense that they can evaluate a math website for mistakes or in other classrooms students are able to evaluate other governments for flaws and successes other than their own.  Students become well-rounded and are able to make decisions on their own from the previous sections of knowledge.  They know the material, use it, created their own projects, and are now prepared for the real world.

Now that you have most of the information the KUCE Taxonomy is built for life-long learners in a pluralistic society, students are well-rounded and prepared for anything.  This system of learning in schools is not adopted yet, but I hope to think that master teachers and reformists in education are built towards this style of learning.  I believe that children are built for learning new things, just not in the classroom but on their own.

The last thing I want to include is the shape I built in for the taxonomy.  The trapezoid shape is developed not only for time students should be spending on each stage, but learning increases as you go up the ladder.  In Bloom's Taxonomy it is a pyramid with a point top, for me this is where learning stops.  In the KUCE Taxonomy it has a open top, learning never stops.  As teachers, we know this all too well.


If you have any comments or suggestions about changes to the taxonomy, please post them below.  How do you think learning would change with these steps instead of Bloom's?  How do you think you could shape your curriculum to fit these stages?

Calculating Weather Probability

When multiplying decimals or percentages in your classroom a great way to incorporate real-world scenarios is how weatherman get their predictions of a percentage of rain in your area.  Take for example the 7 day forecast located to the right.

There is a 30% chance of rain on Saturday, how did they come up with that percentage.

Forecasts issued by the National Weather Service routinely include a "PoP" (probability of precipitation) statement, which is often expressed as the "chance of rain" or "chance of precipitation".

An example of this: 
ZONE FORECASTS FOR NORTH AND CENTRAL GEORGIA NATIONAL WEATHER SERVICE PEACHTREE CITY GA 119 PM EDT THU MAY 8 2008

GAZ021-022-032034-044046-055-057-090815-CHEROKEE-CLAYTON-COBB-DEKALB-FORSYTH-GWINNETT-HENRY-NORTH FULTON-ROCKDALE-SOUTH FULTON-INCLUDING THE CITIES OF...ATLANTA...CONYERS...DECATUR...
EAST POINT...LAWRENCEVILLE...MARIETTA 119 PM EDT THU MAY x 2008

.THIS AFTERNOON...MOSTLY CLOUDY WITH A 40 PERCENT CHANCE OF SHOWERS AND THUNDERSTORMS. WINDY. HIGHS IN THE LOWER 80S. NEAR STEADY TEMPERATURE IN THE LOWER 80S. SOUTH WINDS 15 TO 25 MPH. .TONIGHT...MOSTLY CLOUDY WITH A CHANCE OF SHOWERS AND THUNDERSTORMS IN THE EVENING...THEN A SLIGHT CHANCE OF SHOWERS AND THUNDERSTORMS AFTER MIDNIGHT. LOWS IN THE MID 60S. SOUTHWEST WINDS 5 TO 15 MPH. CHANCE OF RAIN 40 PERCENT.

What does this "40 percent" mean? ...will it rain 40 percent of of the time? ...will it rain over 40 percent of the area?
The "Probability of Precipitation" (PoP) describes the chance of precipitation occurring at any point you select in the area.
How do forecasters arrive at this value?
Mathematically, PoP is defined as follows:
PoP = C x A where "C" = the confidence that precipitation will occur somewhere in the forecast area, and where "A" = the percent of the area that will receive measureable precipitation, if it occurs at all.
So... in the case of the forecast above, if the forecaster knows precipitation is sure to occur ( confidence is 100% ), he/she is expressing how much of the area will receive measurable rain. ( PoP = "C" x "A" or "1" times ".4" which equals .4 or 40%.)
But, most of the time, the forecaster is expressing a combination of degree of confidence and areal coverage. If the forecaster is only 50% sure that precipitation will occur, and expects that, if it does occur, it will produce measurable rain over about 80 percent of the area, the PoP (chance of rain) is 40%. ( PoP = .5 x .8 which equals .4 or 40%. )
In either event, the correct way to interpret the forecast is: there is a 40 percent chance that rain will occur at any given point in the area.

Explaining "Probability of Precipitation": http://www.srh.noaa.gov/ffc/?n=pop

You can have your students multiple percentages and come up with their own weather forecast for the surrounding area for the next couple of days and see if the weatherman in your area are more accurate at predicting than you are.

Other ways of incorporating weather into the math classroom are below:

Do you think you could put more real-world scenarios in your classroom?  Is this a good example to start with in your room?