Showing posts with label project. Show all posts

Gene Davis Inspired Math/Art Project

One of my favorite projects we do is at the end of the first quarter. After we have gone through perpendicular, intersecting, and parallel lines I have an art project that students do. Students have to split up their piece of card stock into 4 equal shapes with a ruler on the front and on the back split the two on the front right down the middle.

I never tell students what the lines are for on the back, but they are for postcards for their upcoming parent teacher conferences. I hang up one set in the classroom and send the others home over time.

When I have them split up the front of the card stock I have them put different types of lines in each rectangle. One for perpendicular lines, intersecting, and parallel lines.

The last rectangle is for Gene Davis.

We talk about Gene Davis the artist and what he did and his accomplishments. I show them different artworks and ask them about what he did and why it is so amazing.

Some of the students think that what he does isn't art and then we look at his artwork on scale about how big each painting is and how time consuming it is for each line.

So after the artist study we finished drawing and filling in each rectangle.

Some of the different artworks are down below:


At the end this is what our Gene Davis Inspired Wall looked like. Students got to take home another one of their creations to put on the fridge and remind them that parent-teacher conferences were coming up and I was looking forward to meeting them.


Domino's Pizza Linear Math Activity

Mathalicious has lots of great activities, but this one might be my favorite.

Here is the link: http://www.mathalicious.com/lessons/domino-effect

All I do as the teacher is give them this prompt:

Domino's pizza is delicious. The company is tech savvy, you can order online and even track your pizza delivery.  The website is great, but not transparent.  Domino's does not tell you how much the component pieces cost; they only tell you an item's final price after you build it. Your job is to find the base price of a pizza and find the cost per additional topping. You need to have enough information to do a 2 minute presentation to the class.


I don't grade the presentations, but look for slope, y-intercept, a graph, an equation, and an explanation of the graph.  It is a fun 30 minute project that fits at the end of the unit.


Algebra Racecars

There are lots of ways to do this activity, if you want your students to construct the same type of car (which is fine) you can follow these links, then come on back.

http://www-tc.pbskids.org/designsquad/pdf/parentseducators/4wheelcar-english.pdf

or

https://www.questacon.edu.au/outreach/programs/science-circus/videos/balloon-powered-car

One way is I have some of the materials that students may need and some others. These are the items that I bring to school:

  • balloons
  • bottle caps
  • smaller dowel rods (from our shop teacher)
  • cardboard
  • tape
  • rubberbands
I give them 15 minutes to create a car. I normally have them as a group create the straw and balloon together so they have the same propulsion system. They have 15 minutes to create and test their car before we record them with our iPad. I normally have them record 2-3 times just to make sure, during this time other students are collecting how far the balloon goes and the time. 

Our next step is to collect our data. 

I ask students to find the speed their car went and ask them to put a graph on Desmos. We then collect our data together as a class and talk about what each line means who's went furthest who had the top speed.


Video Game Success: Making Video Games with Math

Start with Pixel Press Floors

Pixel Press Floors allows you to create your own video game.  In our algebra and algebra 2 units we talk about lines and graphing lines for a solid part of our curriculum.  I wanted students to collaborate and have an ending project that brought a final bang to our unit.

This app allows you to draw on screen (in paper mode) and draw out the different levels of the game. There are a ton of lesson plans and tried and true ideas here: http://www.projectpixelpress.com/education

The Rules for the Project

  • Student's need to create at least one level where they have an undefined, positive, negative, and zero slope.  They also need to have at least one other slope that is different from the rest (e.g. y=-3x instead of y=-x.)
  • Student's level needs to be playable, you need to be able to get from beginning to end as a player of the game.
  • The student's need to take a screen shot of their different levels to show their different slopes and use Desmos to graph each of the different slopes.
Here is an example level:


Students final examples should look something like this:


I want students to have a different final project.  Students will peer assess with others in the room.  Student's will need three other people to play their level and look over their paper they will have to write.  They will have a rubric to fill out about the playability of the game and the features of the game.

How Infographics Boost Math


  • 65% of learners are visual learners.
  • Looking at and reflecting on data is something all students struggle with.
  • Infographics make data easier to understand.
At the beginning of next year I want students take their knowledge and apply it more often.  We normally have a day lesson on classifying rational numbers.  Next year after I give students the lesson they normally have a card sort they do in groups, it is a fun activity and gets them to work together early in the year.

After they are done with the card sort their homework will be to create an infographic.  I will have students download Canva. Canva is a graphic design app that allows students (and teachers) to create presentations, handouts, and other graphics such as infographics.  (I use Canva to create my presentations and handouts for conferences)

Student's will create an infographic on how to classify rational numbers and will be hung up around the room.

Here is an example I made earlier today:


This is a simple mock-up and the rubric for the assessment is yet to come, but having students demonstrate their knowledge in a graphical way will get students on the right path of thinking when it comes to math next year.

Clash Royale and Unit Rates

First of all, what is Clash Royale?

"Clash Royale is a fast paced, card based PvP brawler.  Collect Clash troops, and use them to wreak havoc on your opponents tower." (ClashRoyale.com)  At our school Clash of Clans has gave way to the new Clash Royale game of choice.


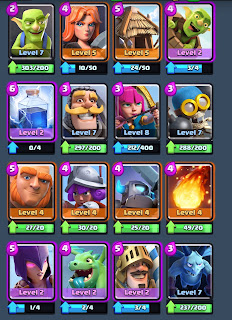
During the game you have battle decks or characters that you play to defeat your opponent friend or stranger.  The goal of the game is to get your characters to take defeat your enemies and take your enemies towers.   So to do that easier is to create a really well put together battle deck.


As a class we would discuss what some students do to build a really well put together battle deck.

Student examples may include: damage, elixir, and different types of cards.

We would further discuss that a combination would be the best way to go, but we are going to put together a battle deck based on damage.  But, further more we are going to put together the best battle deck based on damage per second.  The more damage you are dealing per second the higher chance you are to claim the enemy tower faster.

Here students can download the app and see what to play or they can look online at all the different characters and use their knowledge of unit rates to put together the best deck.  Here are some example characters.


Here is a list of characters and damage and hit speed.

Character          Damage             Hit Speed (in seconds)

Knight                  75                         1.1
Archer                  40                          1.2
Bomber               100                        1.9
Giant                   126                         1.5
Musketeer           100                         1.1
Baby Dragon       100                         1.8
Mini PEKKA      325                       1.8
Witch                   38                         0.7
Skeleton Army    30                           1
Prince                  220                      1.5
Goblins               50                          1.1
Goblin Spears      24                        1.3
Valkyrie               120                       1.5
Minion                40                           1
Skeletons             30                          1
Balloon              600                         3
Giant Skeleton   100                        1.5
Barbarians           75                        1.5
PEKKA              450                        1.8
Minion Horde     40                          1
Hog Rider           160                        1.5

There are other characters they can research, but the work that students will do will be to:
  1. Calculate the damage per second of each character.
  2. Develop their top 8 characters to go in their battle deck.
  3. Develop a written reasoning of why you selected those characters to be in your battle deck
  4.  EC. Try it out, did you win? Did you lose? Write a paragraph on why you won or lost?
I want to engage the students next year.  I know that quite a few of my students play this game and I think this is a great one day project to get students thinking and evaluating data to influence decisions they make.