Showing posts with label desmos. Show all posts

Graphing Polynomials Using Vases 📈🏺

Polynomials is one of the hardest sections to teach, over the past four years I have acquired different handouts, activities, lessons, and tasks for Algebra 2 students and almost no material for the section on polynomials. Adding, subtracting, multiplying, and dividing polynomials always seemed like an algebraic process and not so much visual or hands on.

Now I have one activity!!! Graphing polynomials was always tricky, but teaching quadratics before made it seem like a piece of cake for them. One of my favorites is graphing polynomials using vases, yes vases.

So to preface this I with I spent a week searching all the Goodwills in the Omaha metro area for different vases and this is basically what I found when you take all of the repeats out.


I did replace the big one in the middle and the one on the far right, well you can tell why.

The way I set this up is I provided each group a vis-a-vis marker, ruler, set of measuring cups, and a vase. Students were given the following directions:

1. they needed to mark off every inch on the outside of the glass 
2. make a table for how many mL in every inch.
3. Put the table into Desmos
4. Find the line of best fit on Desmos (I gave them the different equations)
5. Look at the R squared value to find which one is best.
6. Present your vase to the class the following day.

I had students present from their iPads, but having them create a poster would have been better so they could compare and contrast the vase with the graph to identify key attributes.

What is even better the day before the students presented they practiced with a Desmos activity. At the end of the activity students had to create their own vase and graph.


Below are some photos of my students working on their vase.


Conic Section Day 1-3

I always felt that my conic section unit was lacking and needed something that tied everything together. I had a bunch of activities, but nothing that was solid. I decided that the unit needed an overarching theme and some project based learning opportunities. I want it to be engaging and real world.

I settled on roller coasters.

Day 1:
Students have a virtual reality video to watch on DiscoveryVR where they ride a roller coaster. Then they have an introduction to conic sections where they are given play doh and a plastic knife to play surgery, I did this activity last year: Conic Section Surgery


Day 2:

I started with Parabolas and asked them to complete a Desmos Polygraph Activity over Parabolas.

Then I went over the first project with the students, students will construct a working paper roller coaster.


Students started their paper roller coasters.


Day 3:
Students read an article on Newsela about roller coasters and were asked to identify the main point, supporting details, essential elements, and asked them to circle words they didn't know. When they were done reading and annotating they were to summarize the article in two sentences using the essential elements.


Then we went over the first day of parabolas, where students graphed parabolas based on an equation.

Exponential Growth through TAG

After a great day of teaching exponential growth and decay, I felt like my students really knew the topic forwards and backwards. We did this Desmos activity as some students were finish up their MAP test.


It was a great Desmos activity, almost all the students wanted 100$ at the beginning and very insightful finishing questions at the end and I was pleased overall. Later that day I began to wonder if students would notice if something was exponential or not exponential if I gave it to them. I thought to myself how could I find a question that I could do that would model exponential growth or decay.

Then I found this game: 


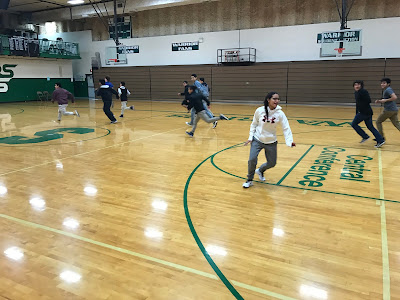
I wanted an activity that got students out of the classroom. Since I have two periods at the beginning of the day we did inside in the gym, but the last time we went outside and played it on the Football field.

If you didn't watch the video, it is a simple game where one person is a shark, they yell "Minnows come out to play." the minnows job is to make it to the other side without getting tagged. The sharks job is to tag people, once a minnow is tagged they become a shark.

Here comes the math:
I had them start out with one shark, I made all the others line up and asked them how easy it was going to be this time down. All of them were confident that they could make it down without any real sweat, then I asked them what about the 5th time down? I was surprised how most of them thought it was still going to be easy, thinking of it linearly instead of exponential. We played it through the first time here are the pictures and the charts we did at the end.


Here is one of the charts that I made after each run down and back.


After all the students were tagged on the 4th down and back with ease. I asked them to estimate how many would get tagged on the fourth time back. Then I asked about the whole school, how many down and backs would there be playing with 576 students?

We came back after playing 2-3 more times. Then asked them how you could write an equation to model the graph. We did a short mini-lesson on finding equations of a exponential graph.


My Favorite: Marshmallow Catapult

When graphing parabolas I had lots of students ask when are we going to use this. One way I wanted to answer the question was by getting their hands dirty and make things. As of lately I have been big into the maker push, where students learn best by building and making things.

Next year I will teach and introduce the catapult at the same time, but this year I used it as more of an activity in between graphing parabolas and solving parabolas. 

To start we watched this video to get their interested sparked: 


Students received 10 popsicle sticks, one spoon, and 7 rubber bands. Their challenge was to create a catapult that will launch a marshmallow more times than any other group. Once students have created their catapult they will test and launch a marshmallow.

Students will take a burst photo and combine these photos on an app called SplitPic. On SplitPic you can have multiple photos overlapped onto one image. Students will put this in Desmos and find the equation of the parabola.

Students will use this picture in a Seesaw activity.  They had to describe the graph of the parabola and what it meant, how using the graph would help them, and do you need to change anything?

Here were some example blog posts:


The next day I gave students 10 minutes to practice, then we put their catapults to the challenge of getting as many shots into a paper bag as possible.  Here were some of the photos of our competition.


Lines of Ballerina Dancers

At the Joslyn Art Museums Thursdays for Teachers we got the chance to sketch 4 ballerinas from the Nebraska Ballet Company. Our workshop first focused on the lines of a ballerina dancer in different poses. It got me thinking about the different lines of a ballerina and in Algebra 2 we are currently going over linear equations. What linear equations do a ballerina make? So I put the pictures in Desmos and this is what I found.

Here are three lines I found.


After I graphed these I thought what a great activity this would be for students. Students could do their own poses and graph them, they could be shooting a basketball, yoga poses, or football poses. 

Then I thought what if we did this every unit and students could reflect on line families and how they relate.  It is one of my big goals I want to student to learn this year: Function families share similar graphs, behaviors, and properties.

Then I tried the same graph with parabolas, which is our next unit. Almost seemed to work better.


Algebra Racecars

There are lots of ways to do this activity, if you want your students to construct the same type of car (which is fine) you can follow these links, then come on back.

http://www-tc.pbskids.org/designsquad/pdf/parentseducators/4wheelcar-english.pdf

or

https://www.questacon.edu.au/outreach/programs/science-circus/videos/balloon-powered-car

One way is I have some of the materials that students may need and some others. These are the items that I bring to school:

  • balloons
  • bottle caps
  • smaller dowel rods (from our shop teacher)
  • cardboard
  • tape
  • rubberbands
I give them 15 minutes to create a car. I normally have them as a group create the straw and balloon together so they have the same propulsion system. They have 15 minutes to create and test their car before we record them with our iPad. I normally have them record 2-3 times just to make sure, during this time other students are collecting how far the balloon goes and the time. 

Our next step is to collect our data. 

I ask students to find the speed their car went and ask them to put a graph on Desmos. We then collect our data together as a class and talk about what each line means who's went furthest who had the top speed.