Showing posts with label activity. Show all posts

Trig Lasers

One of the things I don't get to do often, but love to do is observe other teachers. I get to see how they run the classroom, how their routines are set-up, and sometimes see really cool lessons. In Basic Geometry Mr. Fick and Ms. Groth had a lesson they were talking about that seemed really cool to observe. They had a bunch of different targets printed, lasers, and protractors.

To review the trigonometry they have been practicing in class. Ms. Groth had one student come up and set a target on the front wall of the classroom. She had already set a piece of tape on the ground, she wanted to know the angle that would make it so a laser would shine and hit the target. She asked the class what angle they thought it would be and students guessed. She then asked what other information is needed to know so they could accurately calculate the angle. A couple of students said the height and the distance. Those two students came up and measured both of those. Students were given a handout to write down and then calculate the given angle.

Ms. Groth then did another example where she already gave them the angle and height and they had to calculate the distance away.

I think a great extension to what I saw would to give each pair of students a target, laser, and compass. Then have students calculate their own. Or possibly have some sort of putt-putt kind of station moving from one target to the next.


A Flavorful Application of Mean, Median, Mode

I was looking for a different way for students to apply their knowledge of mean, median, and mode in Algebra 1. I wanted some application where they can use mean, median, and more in a different context. 

I found this article a couple of months ago and found it really interesting.

https://qz.com/918008/the-color-distribution-of-mms-as-determined-by-a-phd-in-statistics/

I had students read this article and groups and come up with what they noticed/wondered about the article. I asked the students if I gave them a pack of M&M's what they would be to extrapolate from the pack. They said they needed to know the total M&M's in the package to determine the location where they were made and the color breakdown inside each one.

Each group of students were given a package of M&M's and had to count how many of each color they had.

Then we put all of our data on the board. Students had to come up with the mean, median, and mode for each color and had to decide which of the data sets to use if they had an outlier or not.


They had to look back at their data and examine which factory their set of M&M's came from. We also talked about what might be different from their graphs to ours and how you might be able to tell the difference between each plant.

This was a great activity for students, they were excited because they got to share and eat their M&M's when they were done.

Graphing Polynomials Using Vases 📈🏺

Polynomials is one of the hardest sections to teach, over the past four years I have acquired different handouts, activities, lessons, and tasks for Algebra 2 students and almost no material for the section on polynomials. Adding, subtracting, multiplying, and dividing polynomials always seemed like an algebraic process and not so much visual or hands on.

Now I have one activity!!! Graphing polynomials was always tricky, but teaching quadratics before made it seem like a piece of cake for them. One of my favorites is graphing polynomials using vases, yes vases.

So to preface this I with I spent a week searching all the Goodwills in the Omaha metro area for different vases and this is basically what I found when you take all of the repeats out.


I did replace the big one in the middle and the one on the far right, well you can tell why.

The way I set this up is I provided each group a vis-a-vis marker, ruler, set of measuring cups, and a vase. Students were given the following directions:

1. they needed to mark off every inch on the outside of the glass 
2. make a table for how many mL in every inch.
3. Put the table into Desmos
4. Find the line of best fit on Desmos (I gave them the different equations)
5. Look at the R squared value to find which one is best.
6. Present your vase to the class the following day.

I had students present from their iPads, but having them create a poster would have been better so they could compare and contrast the vase with the graph to identify key attributes.

What is even better the day before the students presented they practiced with a Desmos activity. At the end of the activity students had to create their own vase and graph.


Below are some photos of my students working on their vase.


Exponential Growth through TAG

After a great day of teaching exponential growth and decay, I felt like my students really knew the topic forwards and backwards. We did this Desmos activity as some students were finish up their MAP test.


It was a great Desmos activity, almost all the students wanted 100$ at the beginning and very insightful finishing questions at the end and I was pleased overall. Later that day I began to wonder if students would notice if something was exponential or not exponential if I gave it to them. I thought to myself how could I find a question that I could do that would model exponential growth or decay.

Then I found this game: 


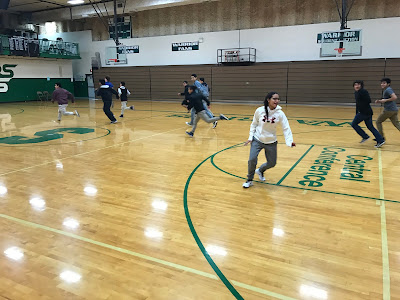
I wanted an activity that got students out of the classroom. Since I have two periods at the beginning of the day we did inside in the gym, but the last time we went outside and played it on the Football field.

If you didn't watch the video, it is a simple game where one person is a shark, they yell "Minnows come out to play." the minnows job is to make it to the other side without getting tagged. The sharks job is to tag people, once a minnow is tagged they become a shark.

Here comes the math:
I had them start out with one shark, I made all the others line up and asked them how easy it was going to be this time down. All of them were confident that they could make it down without any real sweat, then I asked them what about the 5th time down? I was surprised how most of them thought it was still going to be easy, thinking of it linearly instead of exponential. We played it through the first time here are the pictures and the charts we did at the end.


Here is one of the charts that I made after each run down and back.


After all the students were tagged on the 4th down and back with ease. I asked them to estimate how many would get tagged on the fourth time back. Then I asked about the whole school, how many down and backs would there be playing with 576 students?

We came back after playing 2-3 more times. Then asked them how you could write an equation to model the graph. We did a short mini-lesson on finding equations of a exponential graph.


Finding Mr. President (Revised)

A while back I did this activity: http://new-to-teaching.blogspot.com/2015/12/finding-president-obama.html

Students had to find President Obama and his missing hot air balloon. Students had to write and graph inequalities. I did this for Algebra last year and thought it would be a great activity for Algebra 2 at the beginning of the year.

I use to cut out three 3 clues, but this year I changed it up a bit. I still gave students the direction sheet. I did change the other 3 clues to make them look more official.


I blacked out some of the information on the original document and added some of the text of the original clue to the bottom. Plus the top secret on the top looks very cool.


Next was an official letter.


Last was suppose to be a order fill out form from the FBI, I altered the text in the middle to make it a phone transcript.

Domino's Pizza Linear Math Activity

Mathalicious has lots of great activities, but this one might be my favorite.

Here is the link: http://www.mathalicious.com/lessons/domino-effect

All I do as the teacher is give them this prompt:

Domino's pizza is delicious. The company is tech savvy, you can order online and even track your pizza delivery.  The website is great, but not transparent.  Domino's does not tell you how much the component pieces cost; they only tell you an item's final price after you build it. Your job is to find the base price of a pizza and find the cost per additional topping. You need to have enough information to do a 2 minute presentation to the class.


I don't grade the presentations, but look for slope, y-intercept, a graph, an equation, and an explanation of the graph.  It is a fun 30 minute project that fits at the end of the unit.


Rational or Irrational? That is the Question.

One of my favorite beginning of the year activities is a card sort that we do that reviews if different numbers are irrational or rational. Students are placed into groups of 4 and have to reason with one another about the placement of each number.

Here are a few groups placing their numbers:


Here are some example numbers we had:


Here are some finished products:


This was a great activity to get students use to classroom procedures and routines.  You can find the activity here: http://map.mathshell.org/lessons.php?unit=9105&collection=8&redir=1

The activity was in groups and went through each one large group.  I had students explain why they put them in certain categories and had a classroom discussion if they agreed or not.  Some could be put into more than one category depending on the explanation.  It was a fun experience.

Gas Station Problem and Unit Rates

I was at Hy-Vee the other day filling up using our fuel save points when an interesting question popped into my head.  I was thinking if you were a gas station attendant how could you know if a person was using a fuel saver and which pump had the highest fuel saver discount based on the number of gallons and fuel price.

I made this activity to engage student thinking about Unit Rates and instead of fuel saver points they have to find which pumps are losing them money.

So I creepily took down the notes of every pump at the local Hy-Vee gas station, luckily enough I did the math on them all and had some surprising results.

The assignment is here: https://goo.gl/BYaiSn

It focuses on higher thinking about unit rates than we might typically cover.


After students complete this part of the task they have follow up questions:
  1. Which pumps need to be fixed?
  2. How much money was lost if we make $.10 on each gallon sold? Show your work.
  3. How much money did we make?
  4. How did you find your answers? (Write one paragraph)


Coding Sequences with BB-8

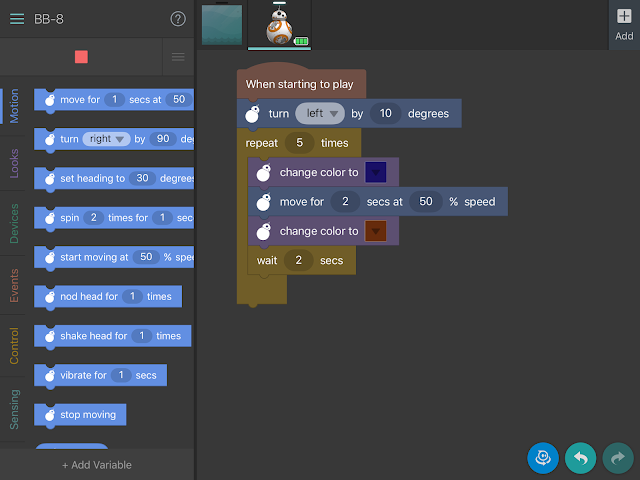
I wanted to do another coding project after "Code Day" I thought the students would benefit from seeing it again.  We had a day between our short chapter on sequences/series and NeSA review of next week.  In class we introduced arithmetic sequences, geometric sequences, and series.  I programmed the BB-8 with a code and asked students what the sequence was, then what the rule was?


Students explained that the sequence was 3, 6, 9, .....

Then what the rule was? Adding three every time.

Then I gave them code and asked them again what the sequence was suppose to look like and what the rule was.


The 10 degrees was to keep it on the number line.

I asked what the sequence should be. Some students said 2, 4, 6, 8, ...

I was impressed with my students, because they asked how far was 2 seconds at 50% speed.  So we played it with the BB-8 and it was somewhere between 2 and 3.

I asked them to download the "Tickle" app.

Students then were to create their own sequence where the BB-8 had to move across the number line. Students had to take a screen-shot of the code and write what the sequence was on Notability and include the photo.


I was incredibly impressed with the amount of effort put in to it.  Even with just one BB-8 from Sphero all students had the chance to get test their BB-8's code.

Here is an example of student's code:


It was a great activity for students to use code and their knowledge of sequences and rules together.


Finding President Obama

Earlier this week I was trying to find a good transition activity between graphing one linear inequality to solving a system of linear inequalities.  I was searching trying to find one decent activity that led students to solve a system of linear inequalities. Luckily I found an awesome activity.  By Ms. Miller at High Tech High.

Obama Activity

In this activity students need to graph and shade clues on a map to determine the location of a missing hot air balloon.  The lesson plan and materials on her site listed above.  My students had a great time with this activity.


The best part of this activity was the homework:


Some students took this homework to the next level.  Writing a letter in math is a great assignment where they have to explain themselves.  Here is one example:


For next year I want to go above and beyond with this activity.  This year I had students in groups of 4, next year I want to move students into the Annex where there are tables and lay out maps and make it more of an escape room.  Using QR codes for the clues will help bring more engagement and activity. Students will go to the library and I will use the iPad and SMART Board to make it seem more real-life.