Showing posts with label algebra 2. Show all posts

Are You Looking for Piece-wise Functions


Reflection: Representations of Relations

The one thing I am really nervous about when starting this new school year is the bell schedule, 35 minutes for one period. What can I get done in 35 minutes? Can I get a Desmos activity done in 35 minutes? Could we do a class project in 35 minutes? I feel like I will be cutting out important discussions or big "ah-ha" moments with less time.

So I went back to thinking about when I start the second day of class with mathematics, I want there to be context in what the students see and do in math. In my last post about Representations of Relations I received this comment:


They changed the focus of that first lesson to make the rest of the year one cohesive goal.

Image result for gif that's what i want

As part of the curriculum group for Advanced Algebra, we set the pacing guide and decided that representations of relations along with the distributive property should be taught first. One thing I want to get across to students that first week is everyone having their voices heard and problem solving.

So each wall of the classroom will have the same layout from the previous post,

  • one wall will have ordered pair along with a piece of butcher paper with notice/wonder at the top. 
  • second wall will have a mapping with a different piece of butcher paper with notice/wonder.
  • third wall will have a table with butcher paper labeled the same way.
  • fourth wall will have the New York Times graph and butcher paper.
I want to have students stand (and gather by the board) and take 1 minute to look and 2 minutes to discuss with a partner what they see. I will ask what students notice first, then wonder. At the end I want them to discuss what was similar or different with the four different relations.

I still have to cover distributive property at the end, but as an exit ticket I want them to reflect on the experience and answer the following question:
Why did the New York Times select a graph to represent this relation?  
I want a connection more to relations, what question should I ask that encompasses what they learned and that representing functions is useful?

Representations of Relations

This is going to be my fifth year teaching Algebra 2, this year I am changing schools so it will be called Advanced Algebra. I was doing some curriculum writing with my new team of teachers and the first section we are going to cover as a class is Representing Relations my first reaction was...

Image result for why gif

At this point with just coming back to school students may not remember what relations are, what functions are, or domain and range.

I thought back to Dan Meyer's talk of headaches and aspirin and why do students need to know there are different ways to represent relations: ordered pairs, tables, graphs, and mapping.

I took the second graph from New York Times: What's Going on in this Graph?  and re-organized the information differently.

Give the students the following information:
This data is organized from by: country (guns per 100 people , mass shooters per 100 million people).
United States (85, 28)
Canada (26, 9)
Afghanistan (2, 20)
Iraq (37, 4)
France (35, 15)
Yemen (55, 40)

Ask the students what they notice? what do they wonder? As the teacher write down everything they say. One question I have is what is the data saying? Is there a different way to represent the data?

Give the students the following information:


What do they notice and wonder now? What has changed? You can show them mapping as well, but eventually you will need to introduce other things, but the last one is the graph from The New York Times.


How do the three representations differ, do they all tell the same story? Do some tell the story better? I'm not sure if this is the way to start the year out, but nothing is perfect. I want students to feel that there is some context to mathematics other than its day 1 therefore we do lesson 1.

Graphing Polynomials Using Vases 📈🏺

Polynomials is one of the hardest sections to teach, over the past four years I have acquired different handouts, activities, lessons, and tasks for Algebra 2 students and almost no material for the section on polynomials. Adding, subtracting, multiplying, and dividing polynomials always seemed like an algebraic process and not so much visual or hands on.

Now I have one activity!!! Graphing polynomials was always tricky, but teaching quadratics before made it seem like a piece of cake for them. One of my favorites is graphing polynomials using vases, yes vases.

So to preface this I with I spent a week searching all the Goodwills in the Omaha metro area for different vases and this is basically what I found when you take all of the repeats out.


I did replace the big one in the middle and the one on the far right, well you can tell why.

The way I set this up is I provided each group a vis-a-vis marker, ruler, set of measuring cups, and a vase. Students were given the following directions:

1. they needed to mark off every inch on the outside of the glass 
2. make a table for how many mL in every inch.
3. Put the table into Desmos
4. Find the line of best fit on Desmos (I gave them the different equations)
5. Look at the R squared value to find which one is best.
6. Present your vase to the class the following day.

I had students present from their iPads, but having them create a poster would have been better so they could compare and contrast the vase with the graph to identify key attributes.

What is even better the day before the students presented they practiced with a Desmos activity. At the end of the activity students had to create their own vase and graph.


Below are some photos of my students working on their vase.


Probability Through Caine's Arcade

First day of our probability unit we watched this video.


Day 1: I chose this video, because most of my students are hispanic and I think the biggest thing in our school right now is empathy. We talked about having games of chance like in the video they just watched, what does chance mean? We did our first section of probability and told them they were going to create their own games, just like Caine did. 

We did a 5 question check for understanding and told the students they needed to finish the bottom half of the checklist today.

Here are other great resources including the checklist: http://cainesarcade.com/schools/activitykits/

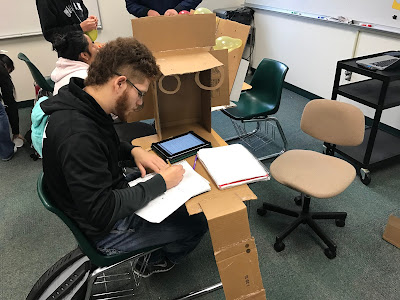
Students designing their cardboard games.

Day 2: We talked about conditional probability. Did another check for understanding on Kahoot. Then I got lots of cardboard boxes from our recycling bin and had to make a quick pit-stop at Dollar General for more cardboard boxes.

Day 3: I had a substitute teacher this day, but students started creating their boxes.


Day 4: We went over theoretical vs experimental probability. I gave students 7 minutes to finish their cardboard arcade games. Then we went over theoretical probability again. We talked about geometrical probability from Day 1. Students were given rulers and yardsticks and had to find the theoretical probability of successfully completing their arcade game.


Day 5: We finished the material for our probability unit. I gave students 5 minutes to make sure their game is playable and to finish anything on the checklist. Then we went over that I would give them 5 minutes to go play other games to get other groups experimental probability, then the partners would switch and the other partner would go play games.


I thought this unit was much better than the 3D dice activity from last year, this project was more hands-on and did a better job of combining the curriculum and the project together.


Statistics Sampling through Articles

In our statistics unit for Algebra 2, we talk about measures of central tendency then we go over different types of sampling. The four we talk about random, convenience, systematic, and cluster. Students don't really know what these are, we talk about when people are surveyed there are different methods to survey those people. Then we go over survey biases. It is a pretty boring lesson, students already know mean, median, mode, and range. They don't really get why we go over types of sampling.

I trimmed down and this article from The Street:
https://www.thestreet.com/story/13954993/1/pictures-of-mcdonald-s-new-big-macs-are-already-sweeping-the-internet.html


To summarize the article it is about the new Mac Jr and Grand Mac, in the article it says, "McDonald's started testing the Grand Mac and Mac Jr. in more than 120 restaurants in the central Ohio and Dallas areas in April last year." This is the basis of what I wanted the students to pick up out of the article, but thought this might be a good chance to get them inferring reading in the math classroom. 

Students read the article, I gave them 5 minutes to read and answer the following 5 questions:

  1. What is the main point of the article?
  2. What are two supporting details?
  3. What type of sampling method was mentioned in the article?
  4. Why do you think McDonald's chose that type of sampling method?
  5. Do you think the authors view of McDonalds were positive or negative? Why?
I was surprised about the level of detail that students put into the article here were some sticky notes and students working on the article.


Next year I will try to put the article on ActivelyLearn, last year it was my go to place for articles and mathematics for Junior Standards Math. I will have to use more articles in math class, it was a good experience for me and my students.

Children's Books for Algebra 2 Part 2

Children's books are a great way to get students interested in your content. Picking the right book is more difficult for the topic area. Here are three more children's books perfect for Algebra 2 class.

We are Growing by Laurie Keller

This book shows grass growing, yes literally. A theme the book has is that being unique is okay and that everyone is different.

A great math topic for using this book would be introducing unit rates or graphing linear functions. You could have some real grass growing in different stages per day and ask them if grass growing is linear or not? It would be a good exploratory lesson on linear functions.

You can further go into graphing and think about what non-linear grass would look like? How long would it take to cut the grass?

Giraffes Can't Dance by Giles Andreae

The giraffe believes he can't dance, but with words of encouragement he learns that he can dance in his own way.

In the book there are a bunch of different animals dancing. It would be a perfect time to look into transformations, you can look at it in a variety of different ways from linear transformations to parabolic transformations.

It will be good for students to look for similarities and differences. With the book you can even include more social learning skills learning about kindness and encouraging others.


Dragons Love Tacos by Adam Rubin

Dragons love tacos. They love chicken tacos, beef tacos, great big tacos, and teeny tiny tacos. So if you want to lure a bunch of dragons to your party, you should definitely serve tacos. Buckets and buckets of tacos. Unfortunately, where there are tacos, there is also salsa. And if a dragon accidentally eats spicy salsa . . . oh, boy. You're in red-hot trouble.


In the classroom this book would be a great introduction to probability. You could talk about what goes in a taco. What ingredients it would take, alternatives, how many different types of tacos are there?

Polynomial Video Games Using Floors

As we were progressing through our polynomial unit in Algebra 2 I thought looking back that the focus was on factoring polynomials and not too much on graphing polynomials. I wanted them graphing polynomials and learning about polynomials without traditionally learning about polynomials.

First, I had students go the graphing calculator on desmos.com had them enter the expression
a x^3 + b x^2 + c x + d = 0

I had them enter sliders and each one around. 

Students had to determine what a, b, c, and d did.

Then they had to find three graphs that interested them and make a video game floor based on those three graphs.  Students had to create 3 levels of a video game based on the three polynomials they graphed. By the end of the weekend they needed a playable working video game and will be peer assessed based on their video game.


Here are some of the students working on their levels.


Finding Mr. President (Revised)

A while back I did this activity: http://new-to-teaching.blogspot.com/2015/12/finding-president-obama.html

Students had to find President Obama and his missing hot air balloon. Students had to write and graph inequalities. I did this for Algebra last year and thought it would be a great activity for Algebra 2 at the beginning of the year.

I use to cut out three 3 clues, but this year I changed it up a bit. I still gave students the direction sheet. I did change the other 3 clues to make them look more official.


I blacked out some of the information on the original document and added some of the text of the original clue to the bottom. Plus the top secret on the top looks very cool.


Next was an official letter.


Last was suppose to be a order fill out form from the FBI, I altered the text in the middle to make it a phone transcript.

Children's Books for Algebra 2

Children's books are are a great way of introducing concepts and to help build a classroom community.  Students love sitting together on the floor and listen to a teacher read aloud a picture book. Letting a picture book and prior knowledge give them a hook into the curriculum.

Here are three great books to help teach some Algebra 2 concepts.


Follow the Line
by Laura Ljungkvist

This picture book goes from the city to farms. Each scene contains questions designed to get children counting, thinking, and observing.  Children would count 5-6 times on each page.

In Algebra 2 class I am going to read aloud the book, but instead of going over the questions in the book I am going to ask different questions.

What types of lines do you see?
Which ones of these are functions?
Which of these are not functions?
What type of slope do some of these lines have?


The Man Who Walked Between the Towers
by Mordicai Gerstein

This picture book is about Philippe Petit who tightrope walked across from one World Trade Center tower to the other. He performed tricks, walking, and dancing for an hour. The book has great and different types of numbers you could number talk during the read aloud.

The way that I am going to use the book in Algebra 2 is to get students use to the idea that mathematical models illustrate the behavior of real world situations.

During the talk I am going to ask the students at specific times to model different situations in the book and ask them about the math being used.


Lifetime: Amazing Numbers in Animal Lives
by Lola M. Schaefer

This book talks about the different animals what can happen in their entire lifetime.

An example, in one lifetime an alligator will build 22 nests and lay 550 eggs.

In Algebra 2 we are going to use this book to introduce students to exponential expressions and how they can be written in different ways.  We are going to talk about If one alligator lays 550 eggs, and then one of those alligators lays 550 eggs. How many alligators in twenty generations?

Beginning of the Year

As we come down to the final week before school starts, I'm getting back in the swing of waking up (semi) early, but still going to bed late. Since I am teaching three new preps my focus will be less on Algebra 2, but it is still my favorite class.

Sequence of Topics
We use Pearson Algebra 2 books, I try to follow the sequencing, but sometimes it doesn't make sense.

Chapter 1- Expressions, Equations, and Inequalities
Chapter 2- Functions, Equations, Graphs
Chapter 3- Linear Systems
Chapter 4- Quadratic Functions
Chapter 5- Polynomials
Chapter 6- Radicals
Chapter 7- Probability and Statisitics
Chapter 8- Trigonometry
Chapter 9- Sequences
Chapter 10- Logarithms
Chapter 11- Rational Functions
Chapter 12- Conic Sections

First Week Activities
To start out with on the first day, not all of our students have iPads yet, so we do a Math About Me to get an easy A and start the year on a positive foot. Students need ten numbers that describe themselves and their picture in the middle or on a presentation, could be digital or paper copies. If students hand in a paper copy it goes on the wall to be my first student work of the year.

Second day I am going to start with a BreakOutEDU game, to show them that this year math will look and feel a little different, I like to focus on activities and projects!

Goals
Find better ways to use the iPad, for activities instead of presenting or worksheets.
Use time more effectively, get students use to bell to bell.
Remember that math isn't serious.

Icebreakers 
Mentioned above, but I do try to learn all my students names the first two days even though the shy ones might squeak through to the following week.

Class Set Up
I am playing around with different organization, but I think I've settled on groups of 4. 

Debates in Math

I have been looking over my Algebra 2 curriculum to find places where I could include debates in the math classroom.  I was trying to find ways of including more formal debates where students take in all of the information.  My goal is to give students a day to find all of the information, that night have them make a poster, meme, or infographic to demonstrate that learning.  The next day students will present their arguments to the class in a fishbowl activity.


  1. The first would be about Functions, Equations, and Graphs.  Students would be split into groups of 2 and one would be graphs the other would be equations.  Students would have debate on which is a better demonstration of functions equations or graphs.
    • Students would then have to produce a poster or meme.
    • Then the next day students would argue about which is better.  A list of questions that I will pose to students to get them talking will be added later.
  2. The second debate would be about Quadratic Functions and Equations. Same concept on groups of two but it would it include the best way to solve quadratics.
    • This time students will be placed into groups:
      • Completing the Square
      • Quadratic Formula
      • Graphing
  3. The last one I will incorporate is probability.  I'm going to go a little off script and give them an article to read and then talk about analyzing data.  Is the article true or not students will have to determine if the samples and survey are sound. 
I will add more as I become more proficient in dealing with debates and keep you posted as we have them in class.